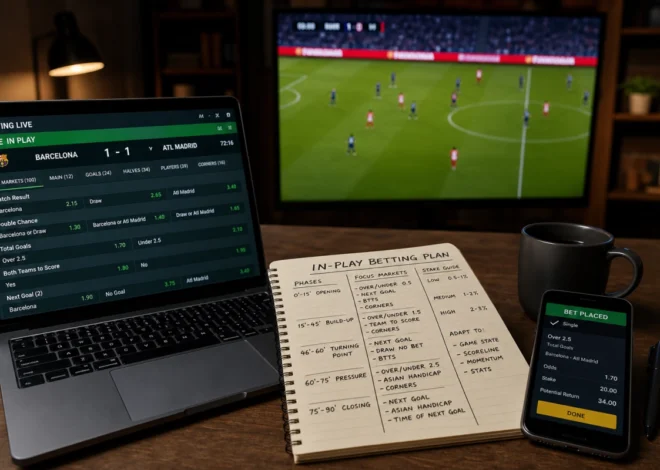

How Live Betting Odds Move: Market Structure, Liquidity and Match Events Explained
Why live betting odds change and why bookmakers disagree
Live betting odds are real-time prices during a match for outcomes such as match winner, handicaps, totals and next-score markets. Bettors see different numbers across bookmakers and exchanges; the mechanics below explain those differences so you can act faster and more rationally.
How market structure, liquidity and liability set prices
Three core elements determine live prices:
- Market structure: Bookmakers set prices to balance action and protect margins; exchanges show peer-to-peer prices driven by matched lay/back stakes. Exchanges often reflect the market view faster; sportsbooks may shade or lag prices for liability reasons.
- Liquidity: The amount traded affects movement. Thin liquidity lets medium stakes swing prices sharply; deep liquidity smooths moves but can hide short-term edges.
- Liability: Bookmakers adjust prices to limit exposure after large in-play stakes, even when statistics don’t fully justify the change.
How match events create divergent prices
Events change probabilities and behaviour differently across providers. Common triggers:
- Score changes: Goals or runs quickly alter match, handicap and totals markets; micro-markets like next-goal react first.
- Cards, injuries, substitutions: Red cards, injuries or key subs cause immediate repricing; some shops update faster than others.
- Momentum, time and latency: Late-game variance and momentum moves (possession, scoring runs) shift lines; differing feed speeds create short windows of stale odds or edges.
Core in-play market types and how they behave
Market structure explains where divergences appear and how to prioritise checks.
Match odds and handicaps
Match odds show final outcome probability. Handicaps shift probability by giving one side goals/points and are often used by bookies to rebalance liability, so they can move differently to match odds.
Totals, next-goal and next-point markets
Totals respond to tempo, cards and scoring runs. Next-goal/next-point markets are the fastest-moving micro-markets because they depend on immediate possession, serve advantage or momentum; they’re where latency and liquidity differences show first.
Risk management remains essential: set bankroll limits, fix stake sizes, and avoid chasing losses after fast swings.
Next is a sport-specific checklist to compare live prices, spot disciplined in-play opportunities, and manage risk across football, basketball and tennis.
Football — step-by-step live price comparison and disciplined in-play checklist
Use this sequence when watching multiple books and an exchange:
- Baseline: note pre-match spreads on match odds and Asian handicaps at a few firms and an exchange to set normal drift expectations.
- Monitor feeds: follow a low-latency book and a live stats provider (possession, shots, xG). If a book lags after a goal or red card, that can be a brief edge.
- Check micro-markets: after significant events, compare next-goal, 0.5/1.5 totals and match/handicap prices; dislocations usually show in micro-markets first.
- Size by impact: assign stake percentages by event severity (e.g., 0.5–1% for moderate moves) and stick to them.
- Prefer handicap moves: bookies often tweak handicaps before match odds to manage liability — that can create relative value on match odds.
- Plan exits: pre-calculate hedges on an exchange and use a 2–3 second buffer after stoppages to avoid rejects or reversals.
Basketball — in-play signals, price checks and risk controls
Basketball markets are tempo-driven and sensitive to lineup, fouls and clock. Key checks:
- Track possession and rotations: lineup changes (star in/out) trigger immediate checks across spreads and quarters.
- Watch clock and fouls: late-clock shots and foul trouble move totals and next-score lines quickly.
- Compare quarters to game lines: shops sometimes lag on quarters after runs — exploit consistent divergences.
- Scale stakes to volatility: reduce units during fast scoring runs and in final minutes; halve units in the last 2–3 minutes if needed.
- Hedge rules: have predefined lay-to-lock-profit or loss limits so emotion doesn’t drive exits.
Tennis — micro-market checks and durable risk management for point-by-point betting
Tennis is granular; serve advantage and feed latency dominate. Follow these steps:
- Know serve stats: keep hold/break and first-serve % visible; next-point/game markets track these closely.
- Use latency as a signal: a book that doesn’t move after a double fault or break point is slow — exploitable only if you can execute instantly.
- Exploit service games selectively: value appears when servers are under-odds after long rallies; back/lay around holds can lock profit.
- Adjust for fitness: long rallies, medical timeouts or cramping increase variance — cut stakes when fatigue rises.
- Preplan exits: map entry markets (next point/game/set) and exact hedge points before betting to avoid chasing.
Universal live-betting execution checklist
Use this short repeatable checklist on every in-play decision:
- Pre-match baseline: note pre-match prices at 2–3 bookmakers and an exchange.
- Confirm feed/latency: identify the fastest feed and use it for immediate signals.
- Classify events: label triggers as trivial, moderate or structural and size accordingly.
- Cross-check after events: compare micro-markets, match odds and handicaps across providers before acting.
- Predefine stake and exit: decide stake, acceptable loss and hedge points in advance.
- Three-second buffer: wait 2–3 seconds after stoppages unless intentionally exploiting low-latency edges.
- Exposure limit: cap total exposure per match (recommended 3–5% of bankroll; reduce for high-variance situations).
- Post-event log and review: record trades and audit performance weekly to refine sizing and rules.
Simple risk templates (examples)
- Conservative: 0.25% bankroll per moderate edge, max 2% exposure per match, hedge to limit loss to 0.5% if reversed.
- Balanced: 0.5–1% per calculated edge, max 3–4% exposure, predefined lay-to-lock-profit at +30–50%.
- Aggressive/trader: 1–2% for high-confidence, low-latency opportunities, strict hedging to cap downside at 5% per match.
- Situational: halve units in late-game football/basketball or reduce tennis units during extended rallies and best-of-five matches.
Putting it into practice
Live markets reward process more than intuition. Commit to the checklist, keep strict records, and iterate from what your data shows rather than gut feeling. Start small, prioritise execution speed and clarity over trying to predict every swing, and treat each trading session as an experiment: measure, learn, adjust. Over time disciplined sizing, consistent cross-book checks and disciplined hedging turn short-lived pricing discrepancies into a sustainable edge while keeping downside contained.

Related Posts

Live Betting Bankroll Management: Sport-Specific Guide to Adjusting Stakes In-Play

How to Evaluate the Best Live Betting Odds: A Practical In-Play Checklist for Matches